Understanding the ECG
The easiest way to grasp the ECG is to first understand what it is you are looking at when you view a tracing. An electrocardiogram captures the electrical activity produced by the heart’s contraction cycle. During each heart beat there is an action potential that is propagated from the SA Node, through internodal tract, the AV Node, to the bundle of his, bundle branches and finally the Perkinje fibers (Figure 1). The electrical impulses generated from the flow of charged particles along this pathway are detectable on the surface of the skin. The detection of this current forms the basis for the electrocardiogram.
Figure 1. Normal conduction pathway of the human heart

The next item you need to grasp is normal direction of the cardiac conduction system. This is best described using the concept of vectors. Remember vectors must have a magnitude and direction. Vectors that are diagonal have an x and y component to them which changes in relationship to the angle of the vector. The normal mean (average) vector of the cardiac conduction system flows in a right to left and superior to inferior direction; forming a diagonal vector (Figure 2.) It is also worth noting that during depolarization current flows from the inside-out (endocardium to epicardium) and during repolarization it flows outside-in (epicardium to endocardium).
Figure 2. The mean vector of the cardiac conduction system
The Leads
ECG leads capture a component of this mean vector. This is best demonstrated by the classic diagram Einthoven’s Triangle (Figure 3) which represents the 3 most basic leads “The limb leads”. In this diagram there are three leads which capture different component vectors of that mean cardiac vector. The direction of the vector for each lead is determined by the location of the terminals or electrodes; negative being the starting point the positive being the ending point.
- For example for lead I the negative terminal is the Right Arm (or right shoulder) and the positive terminal is the Left Arm (or left shoulder), thus Lead I captures a right to left horizontal component of the mean cardiac vector.
It is also worth noting that the electrodes you place on the skin can be used either as a positive terminal or negative terminal depending on the lead being analyzed at that time, the electrocardiogram sorts this out for you.
- For example the left arm electrode is the a positive terminal for Lead I, however for Lead III it’s a negative terminal.
Size and magnitude
Size and magnitude of an ECG lead is determined by it’s angle/direction in relation to the mean vector. The more in line a component vector is with the mean vector the greater it’s magnitude or size will be. Vectors that are in opposite to the mean vector such as in repolarization will be negative. This is usually best analyzed with the QRS complex which represents ventricular depolarization and is the largest electrical event in the conduction cycle.
- For example Lead II uses a negative terminal on the Right Arm (or right shoulder) and it’s negative terminal is the Left Leg, which produces a right to left and superior to inferior vector (sound familiar???). Lead II thus for most people has the largest QRS complex magnitude since it’s vector falls almost exactly inline with the mean cardiac vector. Lead I provides an analysis of a right to left horizontal vector; which is in the general direction of the mean vector but only a component. Thus Lead I the QRS is typically positive but with a smaller magnitude.
- This is also why for basic screening and monitoring Lead II is used since it best captures the normal electrical activity of the heart.
Figure 3 Einthoven’s Triangle

Location
Though both terminals are important, the positive terminal determines the “area” of the heart being analyzed. You could say the positive terminal is the eye that you look at the heart from.
- For example Lead I the positive terminal is the Left Arm which is to the left and superior to the left ventricle, which would place it “lateral” position. Thus lead I analyzes the lateral wall of the left ventricle.
- Lead II and III have positive terminals on the Left Leg, which is inferior to the heart. Thus they are considered “inferior leads”.
- For all intents and purposes most ECGs don’t provide a lot of detail about the right ventricle.
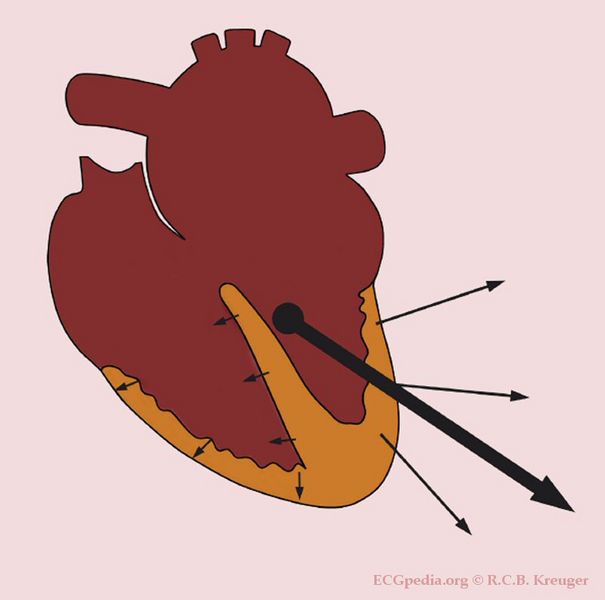
ECG Mapping
Since each lead represents a particular area of the heart and from anatomical studies we know which coronary artery supplies it, changes in those leads can reflect the function or dysfunction in both (Figure 4). This is most useful when determining the location of an infarction.
Figure 4. ECG Mapping
| Leads | Location | Coronary Artery |
| V1, V2 | Septal | LAD |
| V3, V4 | Anterior | LAD |
| II, III, avF | Interior | PDA (80% RCA 20% LCx) |
| I, V5, V6, avL | Lateral | LCx |

