One of the most important components of interpreting an ECG is understanding the normal intervals and what they represent. ECG paper (Figure 1) is helpful in understanding this as it’s organized and scaled to illustrate to those normal intervals.
Figure 1.

ECG paper Key
- Thin Lines: 1 mm intervals or 0.04 sec
- Thick lines: 5 mm intervals or .2sec
- 1 thick lined box (5 small boxes) = .20 sec or 5mm
- 5 thick lines boxes (25 small boxes)= 1 second
- 10 mm = 1 mV
- Tick Marks on ECG paper rhythm strip: 3 secs
The Basic Intervals and Waves
P Wave:
(Include image with each wave or interval highlighted)
- Represents: Atrial Depolarization
- Normal:
- Duration: < 0.12s OR 3 small boxes)
- Amplitude: < 2.5mm OR 2.5 small boxes)
- Best assessed at V1
P-R Interval:
(Include image with each wave or interval highlighted)
- Represents: The propagation of the cardiac action potential from the atria through the AV node into the ventricles.
- Normal:
- Duration: 0.12- 0.2s OR 3-5 small boxes
- Will shorten during exercise as heart rate increases
QRS Complex***:
(Include image with each wave or interval highlighted)
- Represents: Ventricular Depolarization
- Normal:
- Duration: 0.06- 0.10s OR 1.5-2.5 small boxes,
- Some healthy patients may have wider QRS (0.10-0.12s), so the absolute cut off is 0.12s
- Amplitude:
- >0.5 mV in at least one standard lead (5 small boxes)
- >1.0 mV in at least one precordial lead (10 small boxes)
- Upper limit 2.5 – 3.0 mV (25 small boxes
- Duration: 0.06- 0.10s OR 1.5-2.5 small boxes,
T wave:
(Include image with each wave or interval highlighted)
- Represents: Ventricular repolarization
- Normal: It’s deflection should be the same direction as the QRS complex (ie if the QRS is positive the T wave should be positive). In leads aVR and V1 it is normal for the T wave to be negative, however the QRS is also negative
S-T Segment:
(Include image with each wave or interval highlighted)
- Represents: The interval between ventricular depolarization and repolarization.
- Normal: A discrete ST segment distinct from the T wave is usually absent. More often the ST-T segment is a smooth, continuous line beginning at the J-point (end of QRS), slowly rising to the peak of the Twave and followed by a rapid descent to the isoelectric baseline.
R-R Interval and Rhythm:
Rate
- Represents: The duration between subsequent “heart beats”. This is duration is used to calculate heart rate.
- Normal: Should be regular and consistent, especially at rest.
- Will shorten during exercise as heart rate increases.
Rhythm:
- Regular : RR interval constant
- Regularly irregular : RR interval variable but with a pattern. Normal and ectopic beats grouped together and repeating over and over.
- Irregularly irregular. RR interval variable with no pattern, totally irregular
Heart Rate
Method 1
Take the duration between two identical points of consecutive normal ECG waveforms such as the R-R duration (keep units in seconds). Then this duration and divide it into 60. Though this method is fast and easy, it’s only reliable if the rhythm is regular.
The resulting equation would be: Rate = 60/(R-R interval)
- Example
R-R interval = 0.6s
Rate = 60/(0.6s)
Rate = 100bpm
Method 2
Count the number of RR intervals between two Tick marks (6 seconds) in the rhythm strip and then multiply by 10 to get the bpm. This method is more effective when the rhythm is irregular.
- Example
Method 3
Use the R-R interval between two consecutive normal ECG waveforms. Count the small boxes between the thick line before and after the 2nd R wave. Use the scale below to determine the estimated reference range for heart rate. Though this method is fast and easy, it’s only reliable if the rhythm is regular.
- Example:
The 2nd R wave lands between 4 and 5 thick black lines. Thus the interval used is 75 to 60, thus every small box is 3 beats (75-60 = 15; 15/5boxes = 3 beats)
***You may have noticed that there is no interval or wave for atrial repolarization. This is due to the fact that the amplitude of ventricular depolarization is so large that is dwarfs atrial depolarization. So it does happen but it usually isn’t captured on a normal ECG***
Advanced Waves and Intervals
Q-T interval:
- Represents:
- It represents the time taken for ventricular depolarisation and repolarisation.
- Shortens during faster heart rates, lengthens during slower heart rates
- Normal
- Duration
- Men 0.4- 0.44s OR 10-11 small boxes
- Women: 0.44- 0.46s OR 11-11.5 small boxes.
- Duration
J point:
- Junction between the termination of the QRS complex and the beginning of the ST segment.
- Represents: The initiation of ventricular repolarization
U Wave (The most ignored ECG waveforms):
- U waves are more prominent at slower heart rates and usually best visualized in the right precordial leads (V1-V3).
- Amplitude: 1-2mm or roughly < 1/3 the amplitude, in the same direction of the T wave in the corresponding lead.
- Origin of the U wave is still up for dispute but is thought to be related to 3 causes:
- Delayed repolarisation of Purkinje fibres
- Prolonged repolarisation of mid-myocardial “M-cells”
- “After-potentials” resulting from mechanical forces in the ventricular wall
R wave progression:
- Small R waves begin in V1 or V2 and progress in size to V5.
- The R in V6 is usually smaller than R in V5.
- In reverse, the s-waves begin in V6 or V5 and progress in size to V2.
- The S in V1 is usually smaller than the S V2.
- The usual transition from S>R to R>S in the left precordial leads is V3 or V4.
The Systematic Approach to Interpretation of the ECG
Similar to any clinical assessment it is important to utilize a consistent approach to examination, interpretation of the ECG is no different. This improves the speed and most importantly the reliability of your assessments, especially when you encounter an arrhythmia . Below I have included my recommendation on how read an ECG
- Rate?
- Is the rate fast or slow (R-R Interval and 300, 150, 100 rule)
- Rhythm?
- Regular or irregular (R-R Interval consistent or not)
- Are a P wave and QRS complex with each cycle?
- Do the P waves look alike?
- Is there a P wave preceding every QRS
- Is the PR interval within normal limits?
- Is the QRS duration within normal limits?
- Where does the rhythm come from; Sinus, Supraventricular, or Ventricular?
- Sinus (SA Node): Normal QRS preceded by a normal Pwave each time
- Supraventricular (AV, atria, nodal tracts): Normal QRS, however P wave absent or abnormal
- Ventricular (Below AV Node ie, Ventricles): Wide QRS, P wave absent
- Does the atrial rate (number of p waves/min) = ventricular rate (number of R waves/min)?
- Should be 1:1
- T Wave?
- Should be the same deflection as QRS?
- S-T Segment?
- Should be isoelectric ie, on the same level of the PR segment.
- When correlated with clinical observation of the patient, what is the significance of the rhythm?
- THINK OF THE HEMODYNAMIC CONSEQUENCE!!!!!
Normal 12 Lead ECG
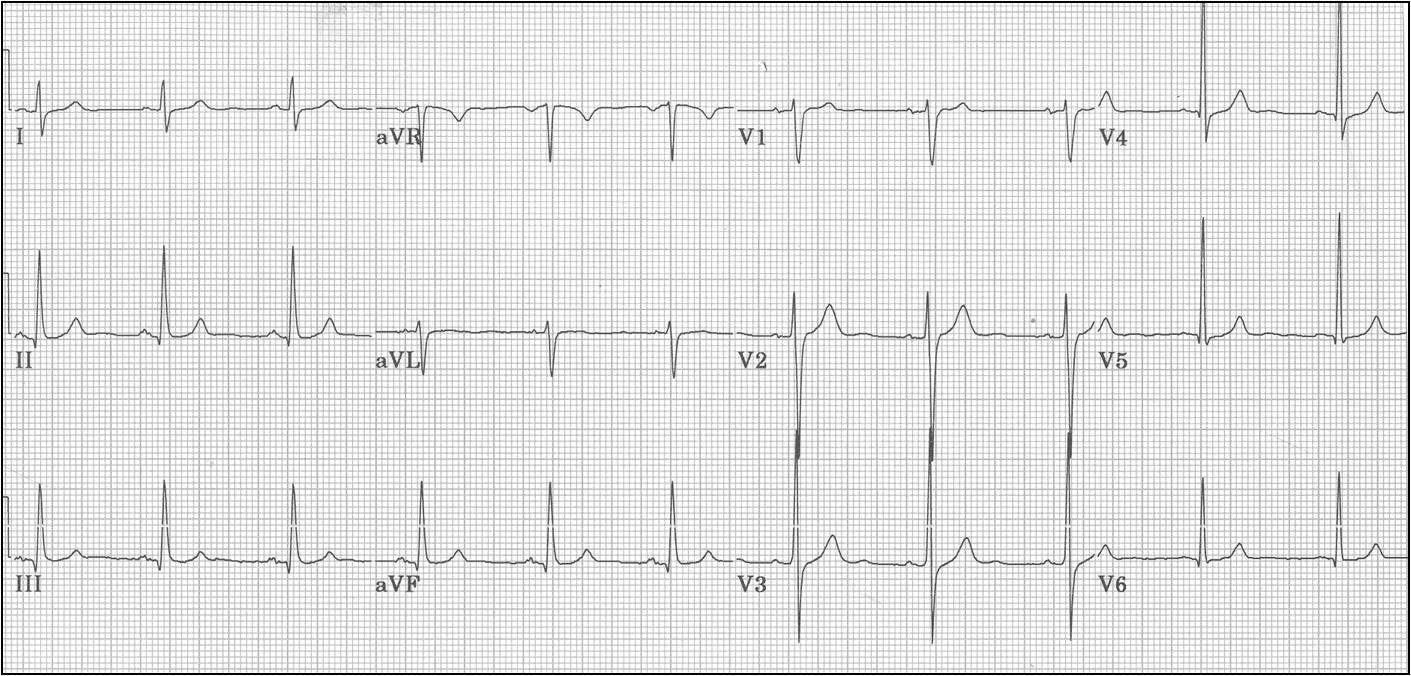

It gives general idea of the heart condition , here you need to give the clear figures of normal ranges age wise.
Thanks